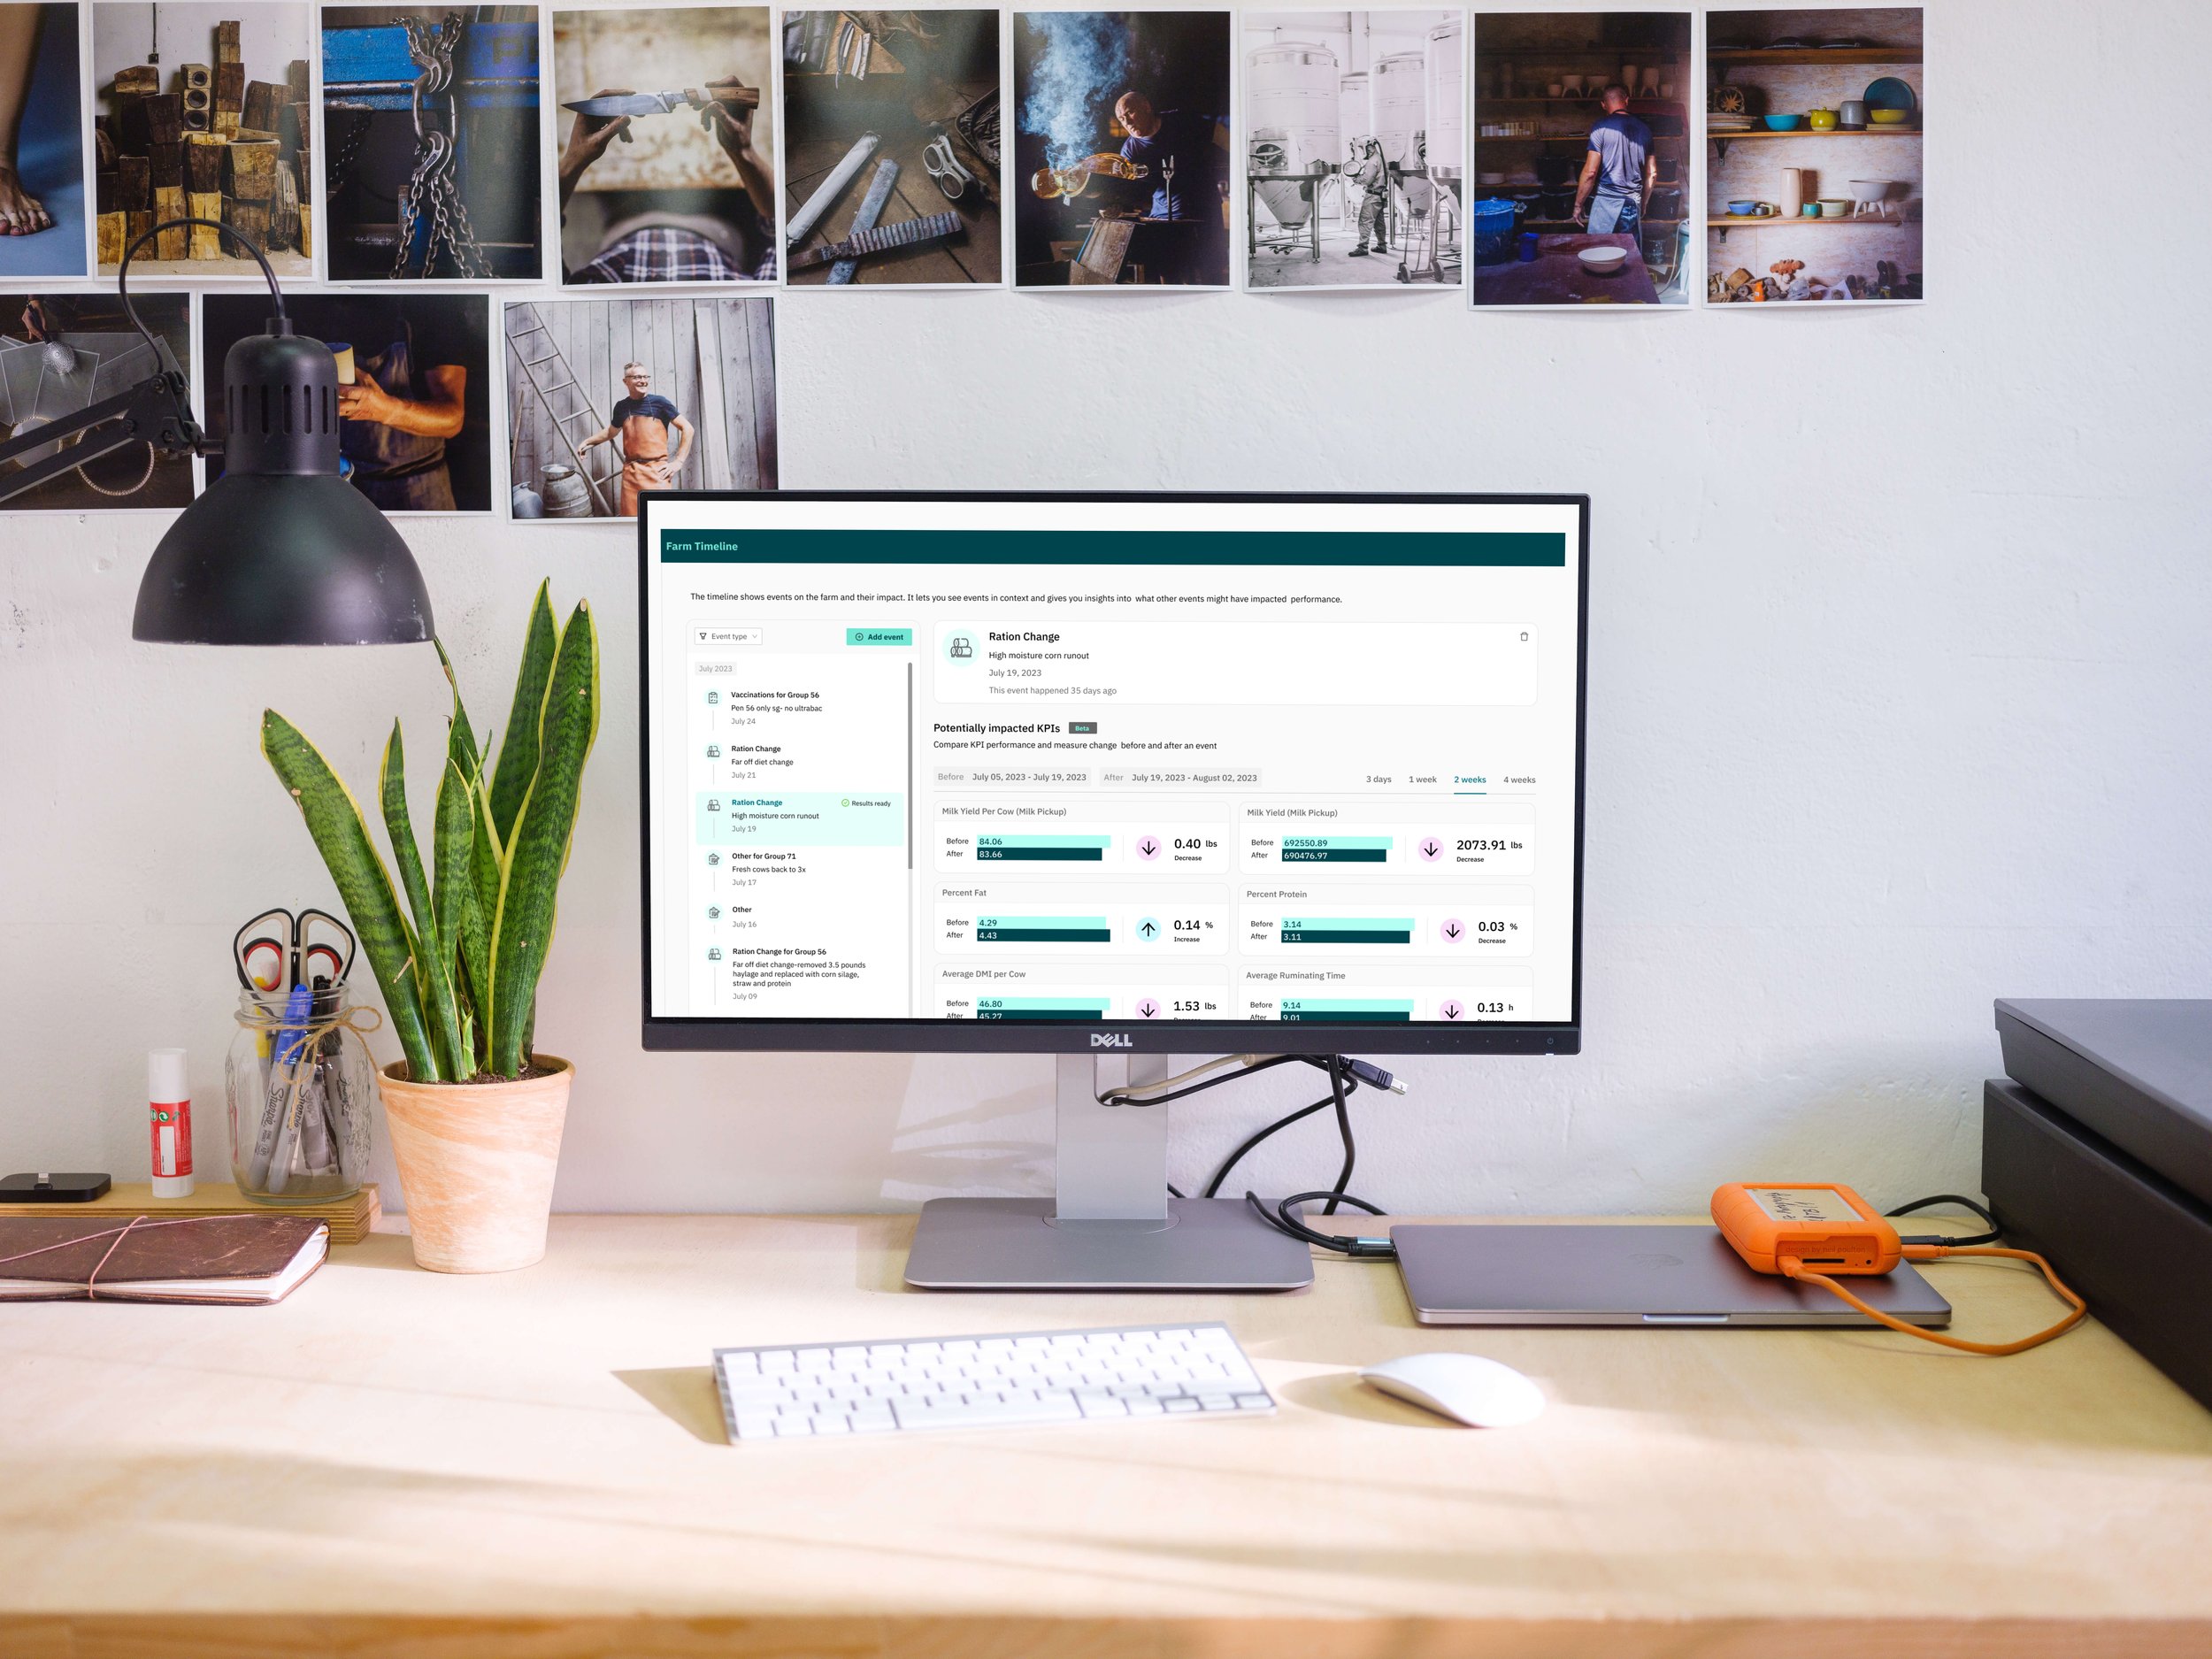
Farm Timeline
Impact tracking in Smart Dairy farming. A digital tool for farmers and advisors to easily track the impact of events and changes on key metrics
Project Overview
In the dairy industry, farmers and advisors constantly make changes to optimize animal health and performance, but tracking the effectiveness of these adjustments has long been a challenge. Many farmers rely on manual methods, such as calendars or note-taking apps, making it difficult to remember when changes occurred or assess their impact.
Our goal was to design a solution that enabled farmers and advisors to easily track the impact of these changes and make informed decisions based on data.
“I don’t know what we would do without it ”
My Contribution
As the lead UX designer, I interviewed farmers and advisors to identify pain points and mental models, created and validated wireframes, conducted contextual inquiries at U.S. farms, tested prototypes and worked with frontend, backend, and data science teams to implement and release the final designs
Research
Previous research had identified impact tracking as one of the top Jobs to be Done (JTBD) for farmers and advisors.
We needed to validate the importance of this job and explore potential solutions.
Research Methodology
Interviews: Conducted over 15 in-depth interviews with farmers and advisors to understand their mental models and pain points.
Field Studies & Contextual Inquiry:Visited farms in the U.S. to observe how changes were tracked and how decisions were made in real time.
Prototyping & Testing: Created and tested wireframes with 6 users in two iterative cycles before moving to high-fidelity prototypes that used real farm data.
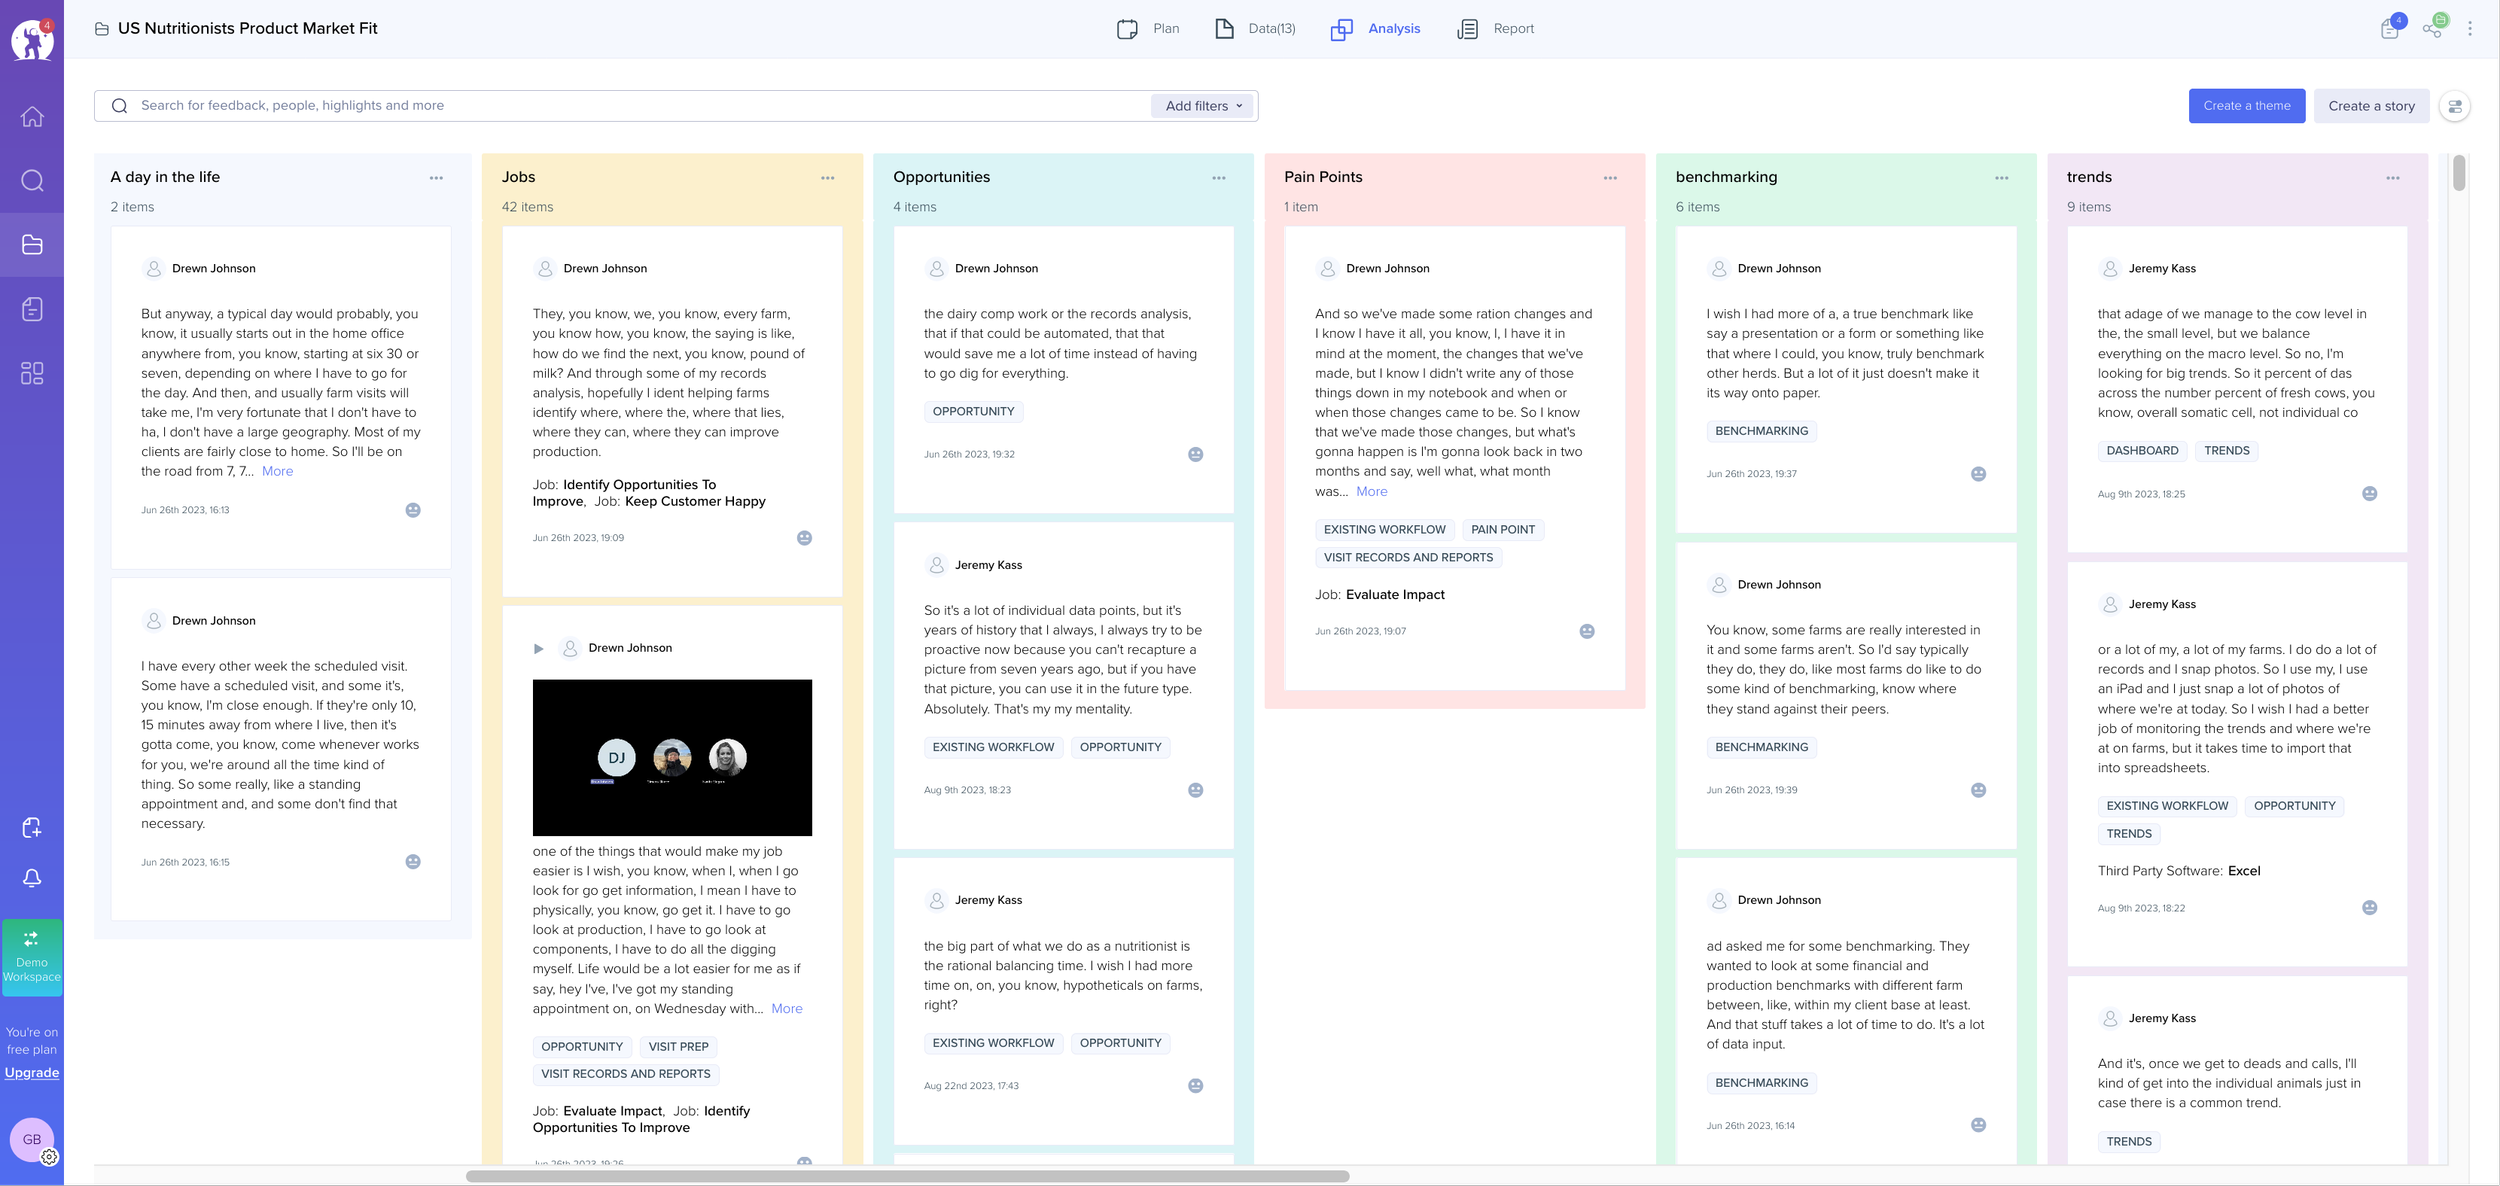
During this project, I set up a research repository using to systematically categorize insights and feedback, streamlining future research efforts.
Key Pain Points Identified
Manual Tracking: Most farmers relied on calendars or paper records, making it difficult to track when changes were made or to evaluate the results.
Lack of Impact Assessment: There was no easy way to quantify the effects of changes, leaving decisions based on guesswork rather than data.
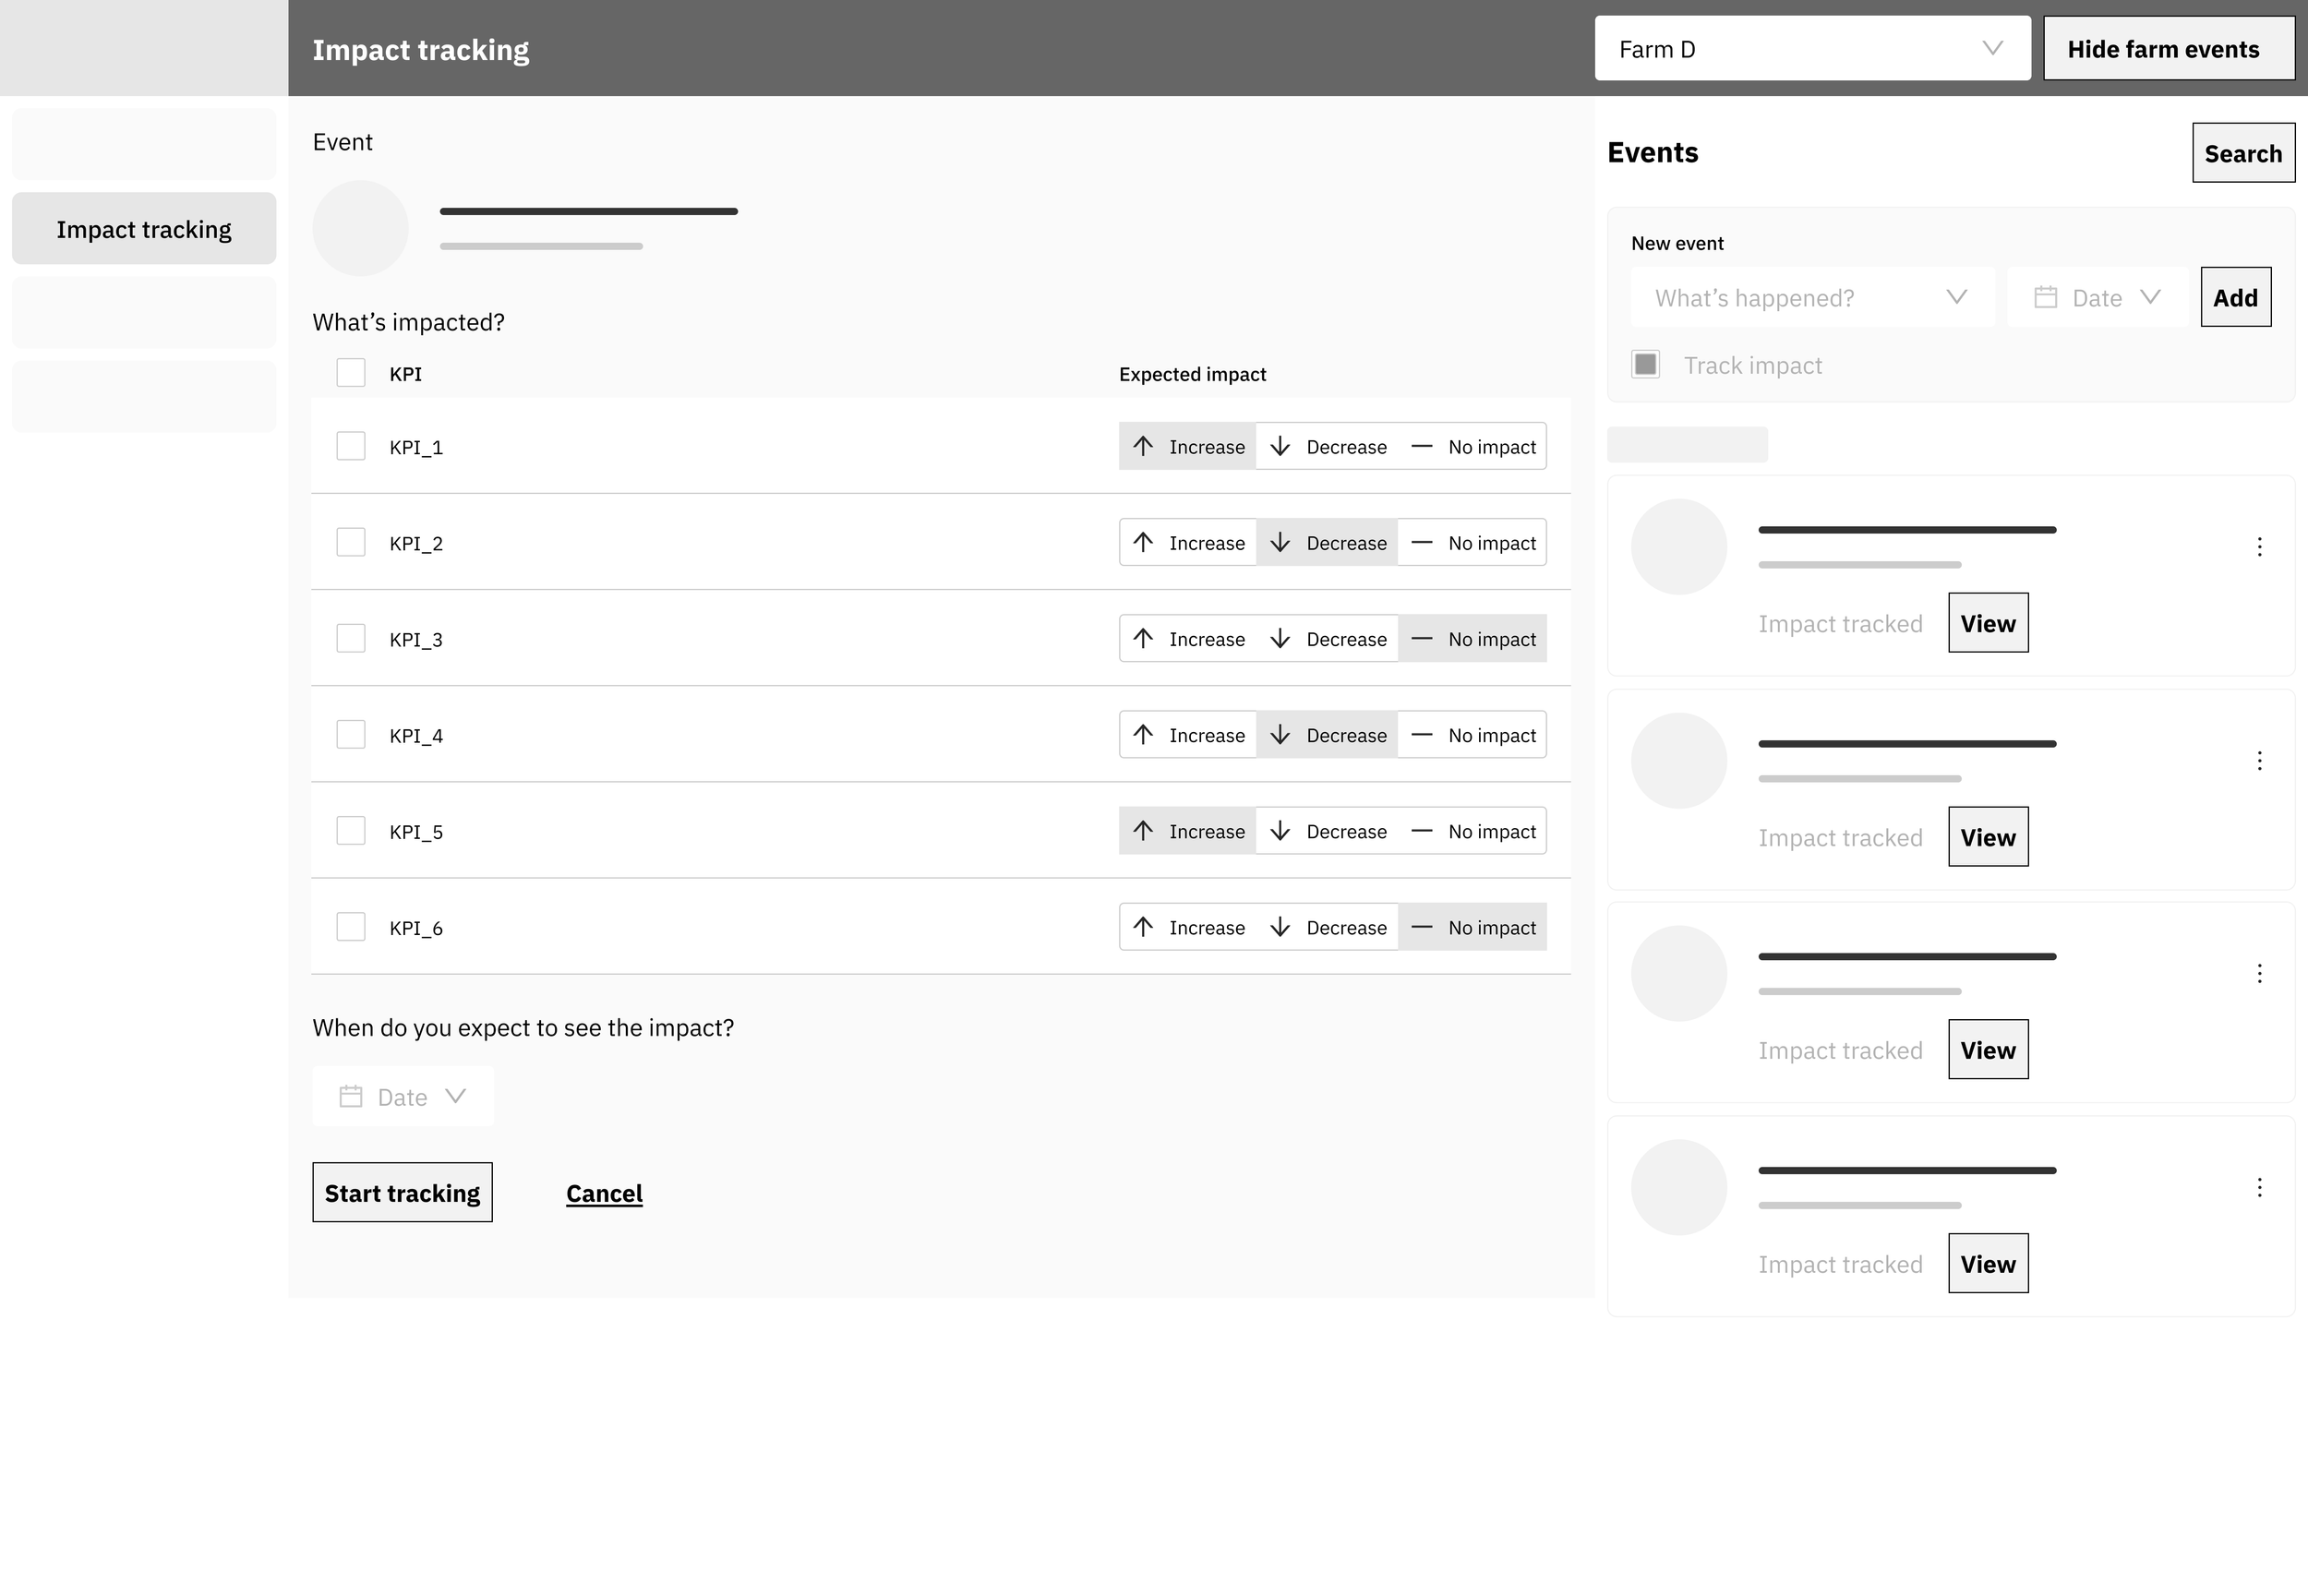
We considered different interaction layouts and patterns, settled on the one that was simple and had more room for growth.
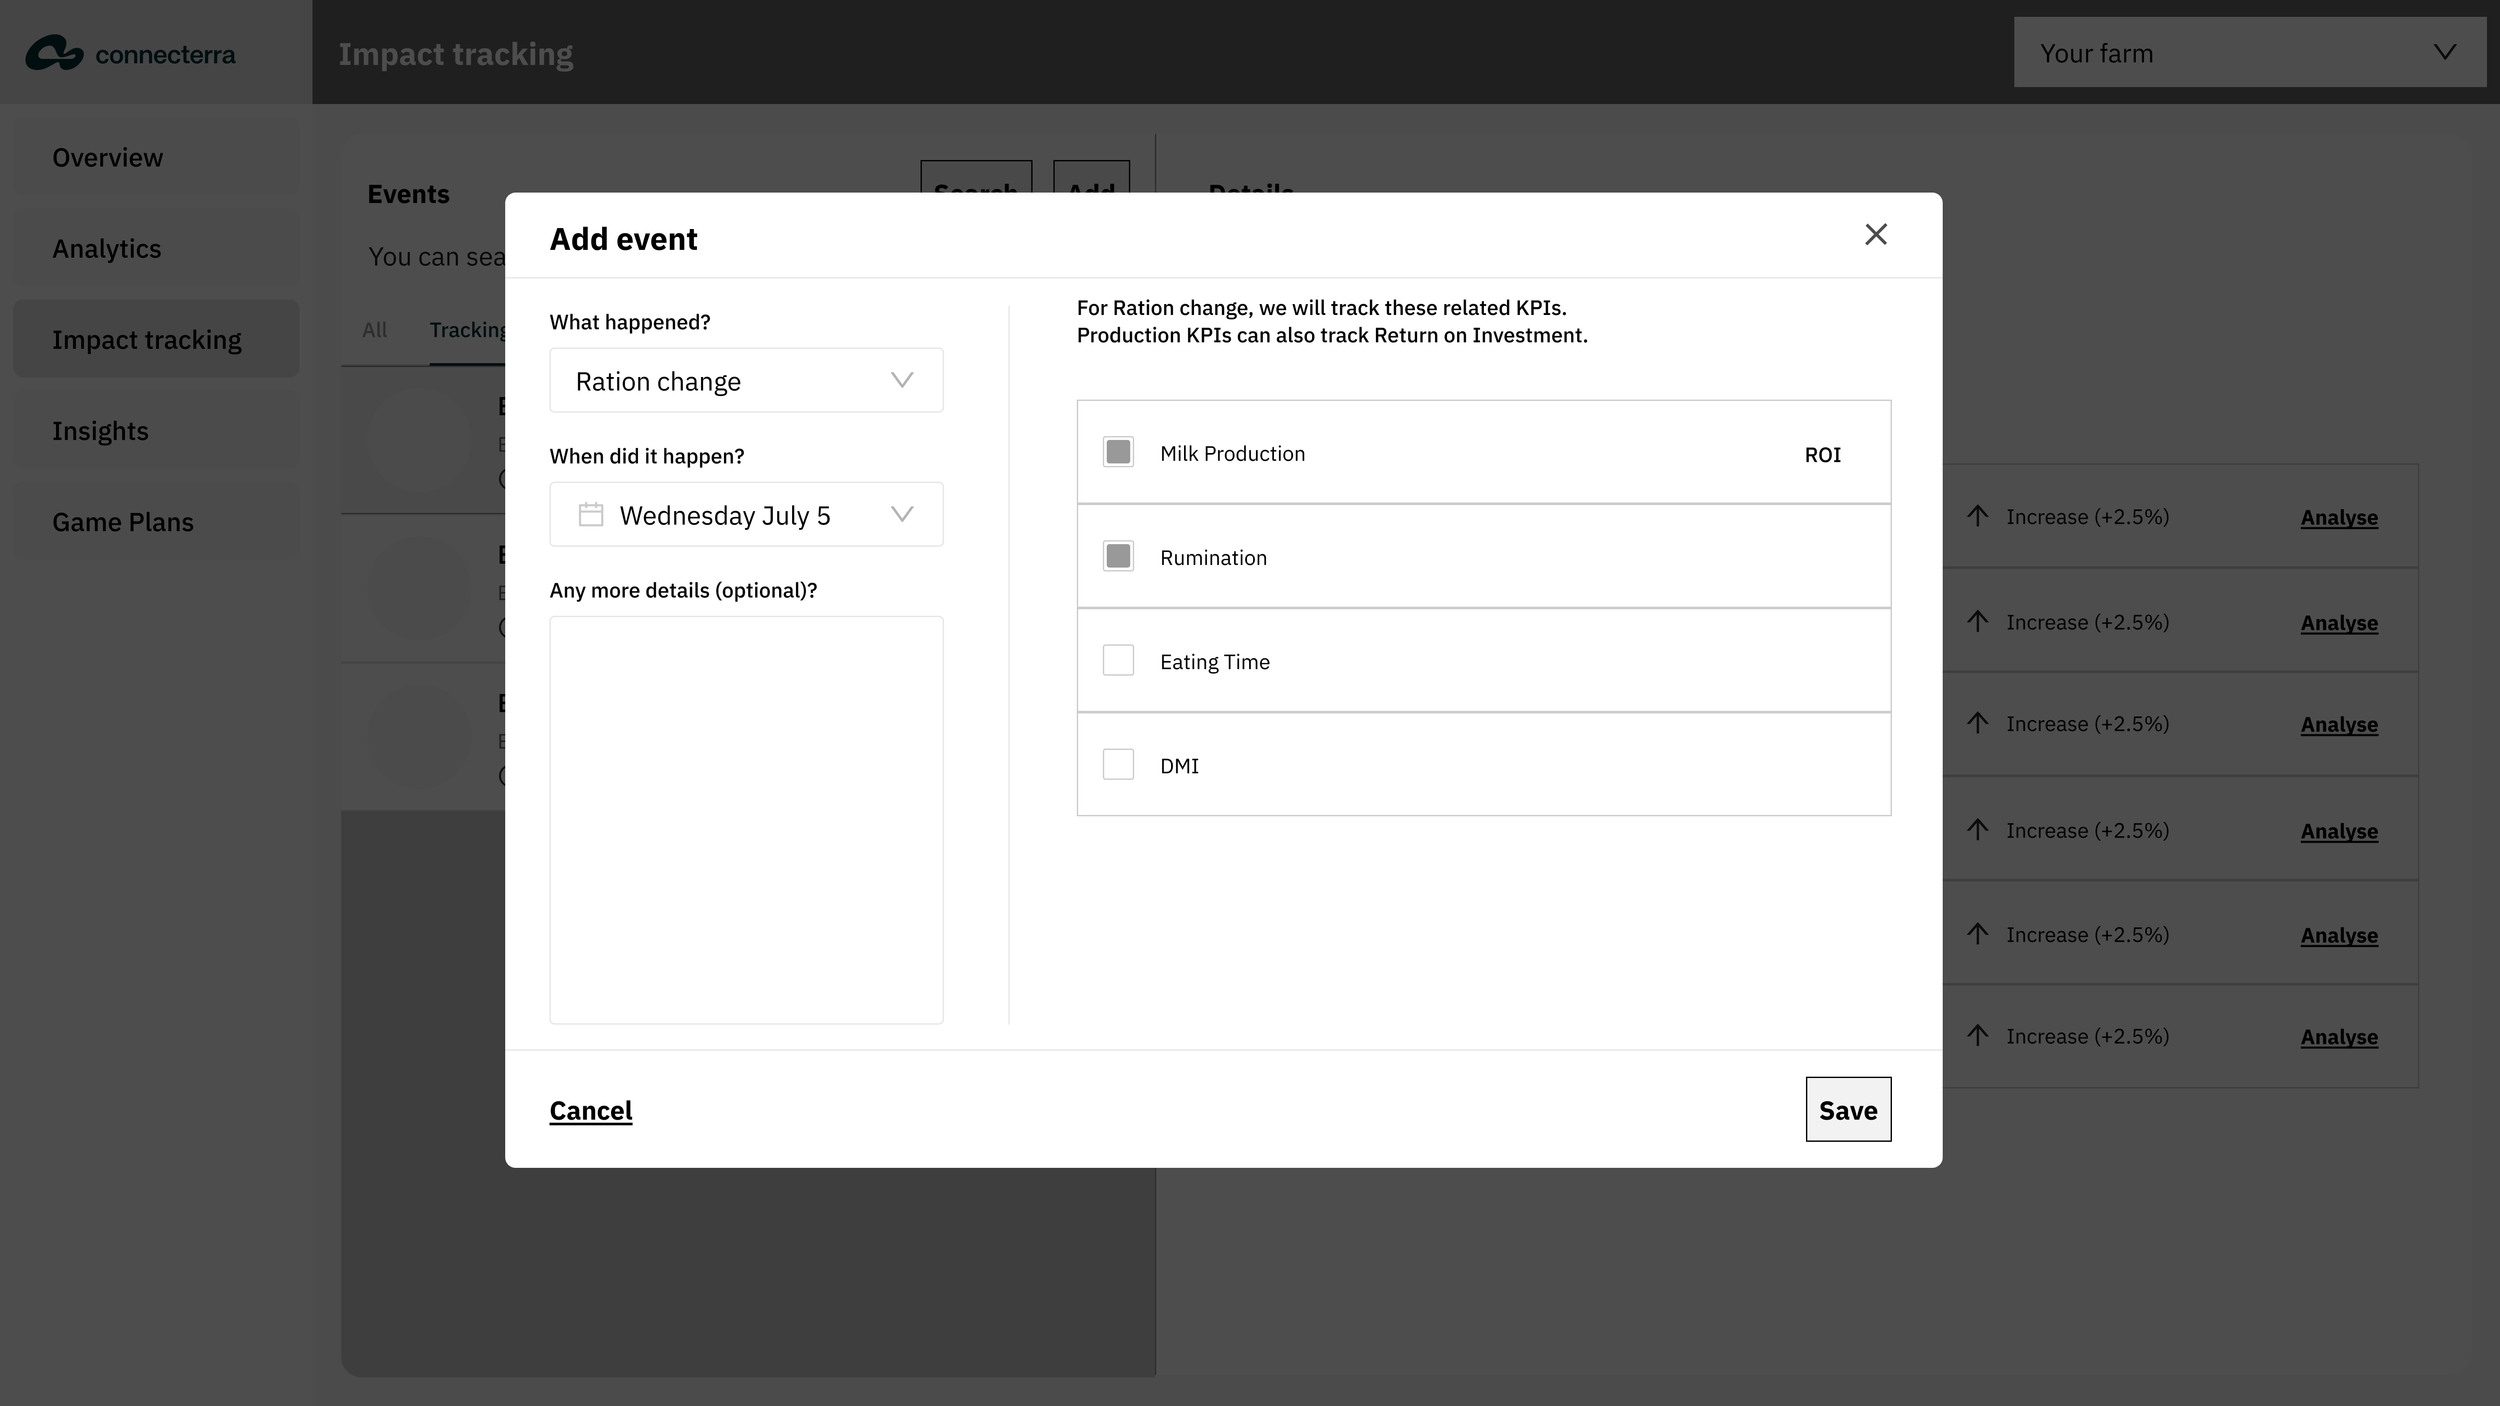
Early wireframe with manual selection of metrics
Wireframes & Early Prototypes
Developed low-fidelity wireframes to explore possible interaction patterns and gather initial feedback. Based on this, we discarded certain ideas early
When to stop tracking?
Users were not interested in projected values
Or return on investment
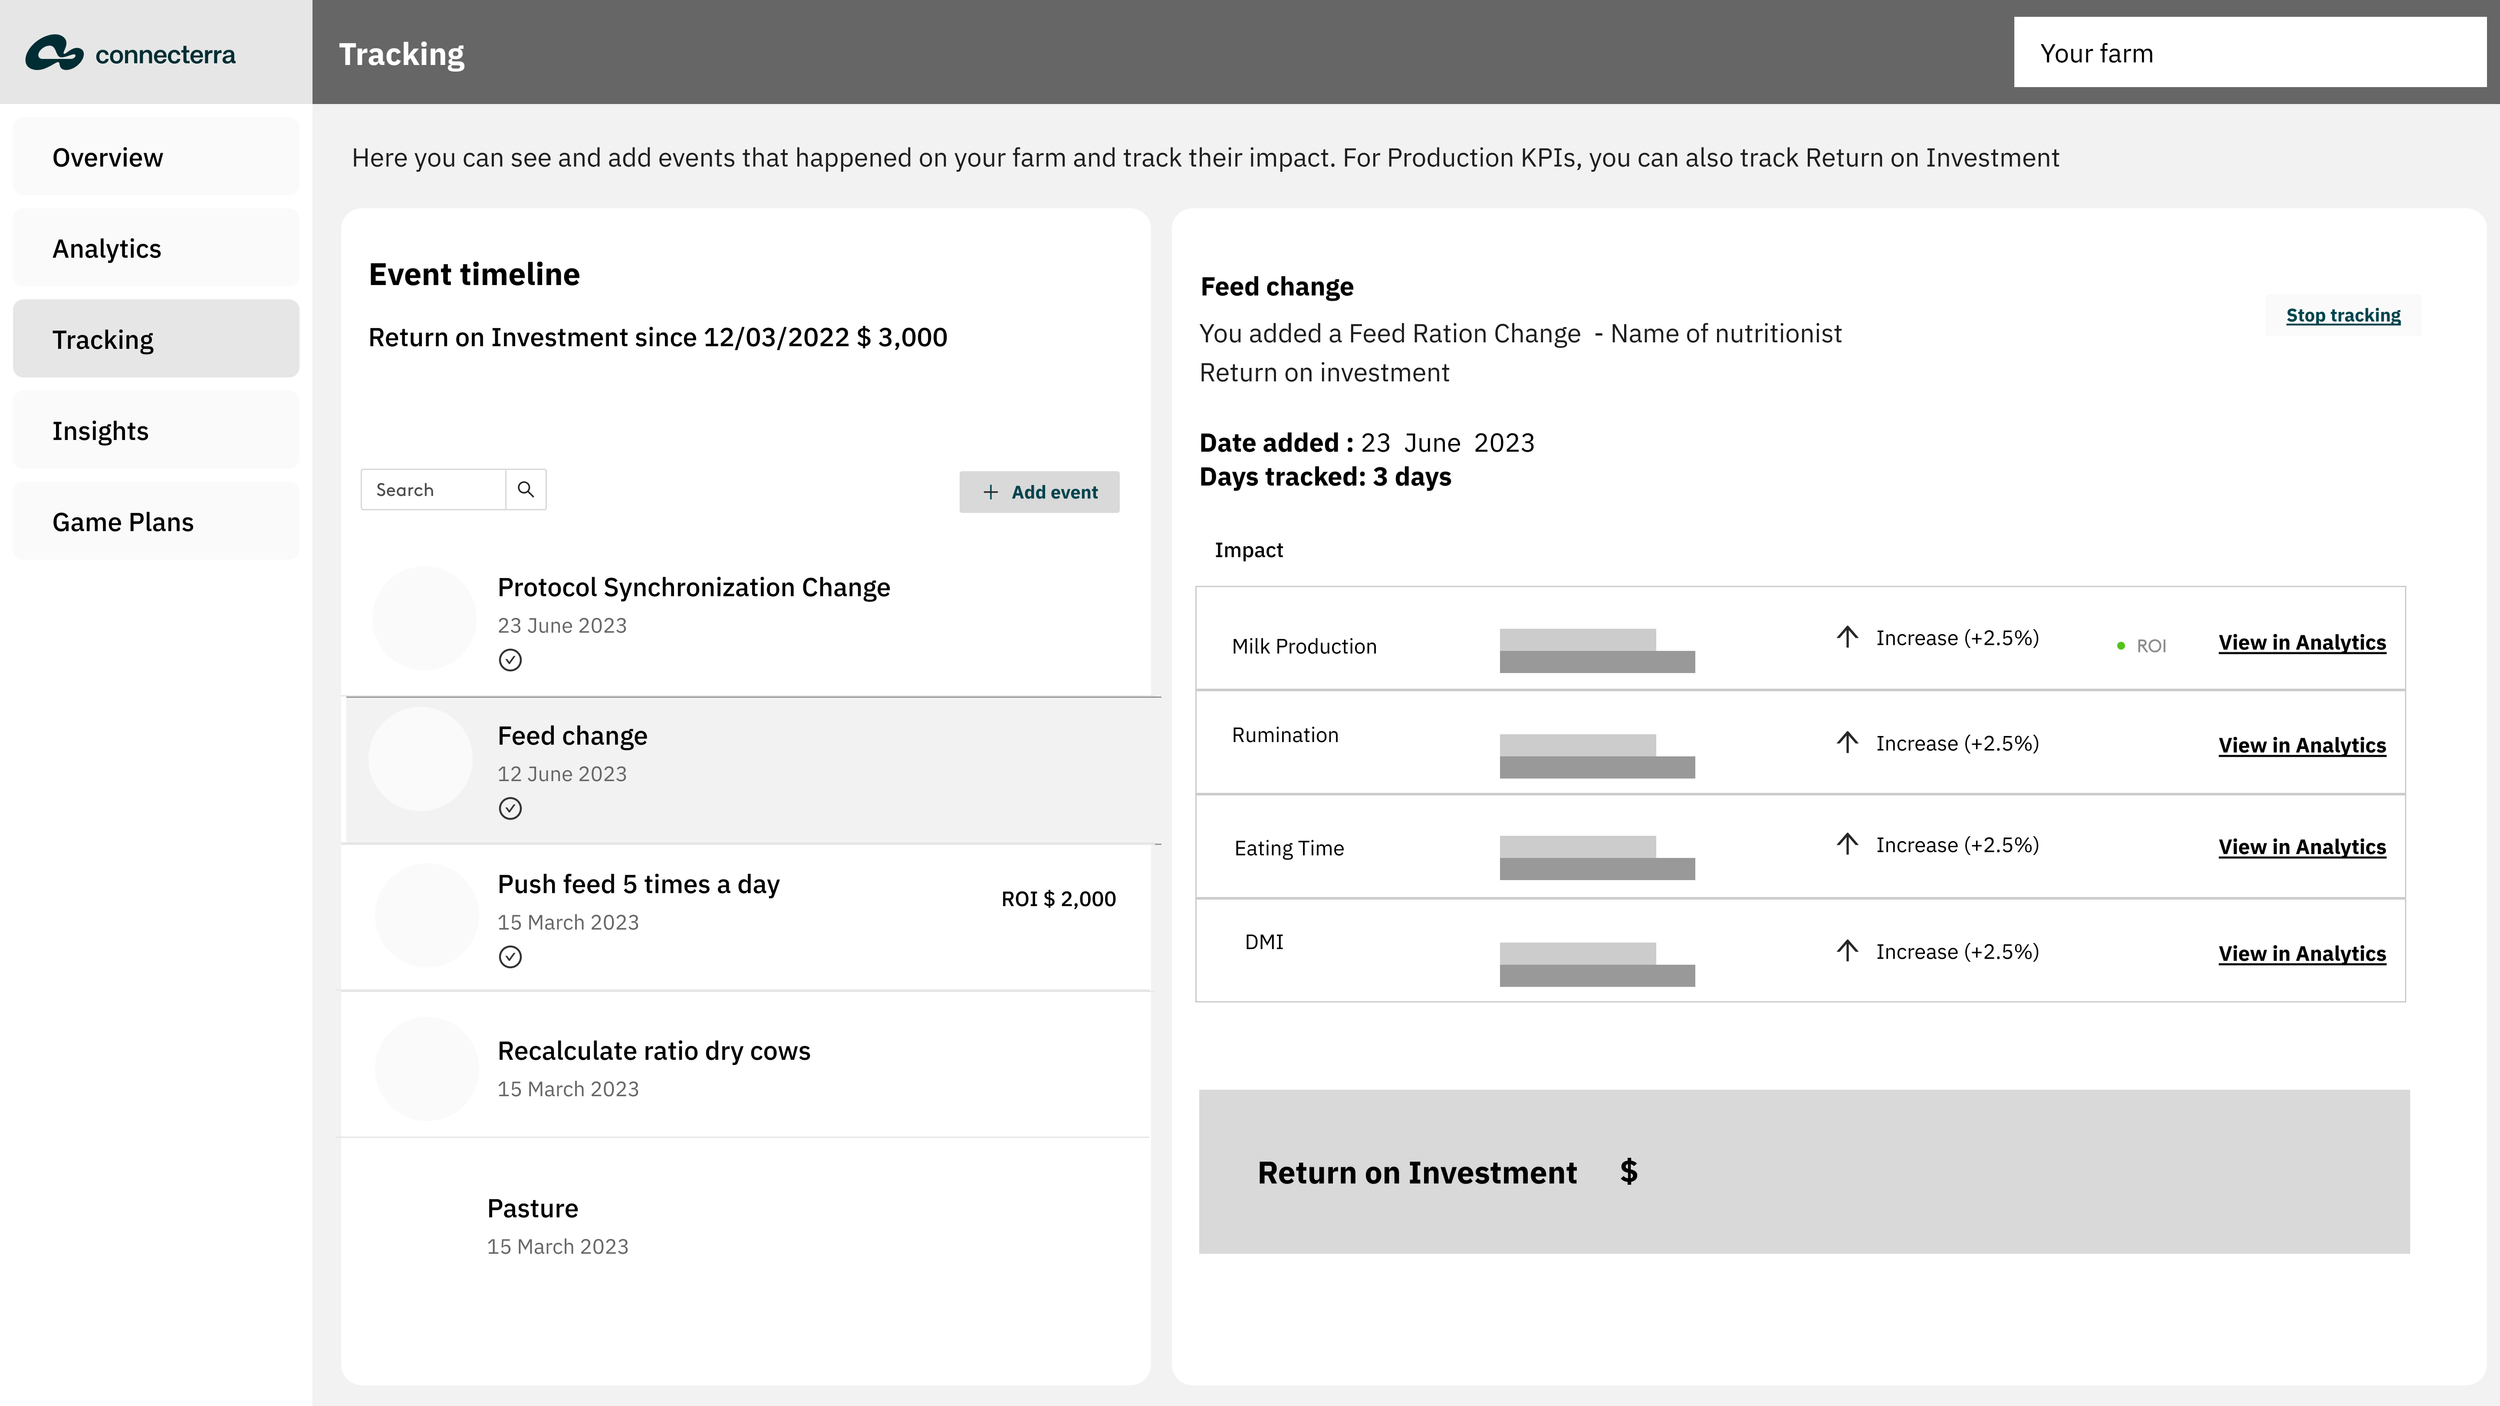
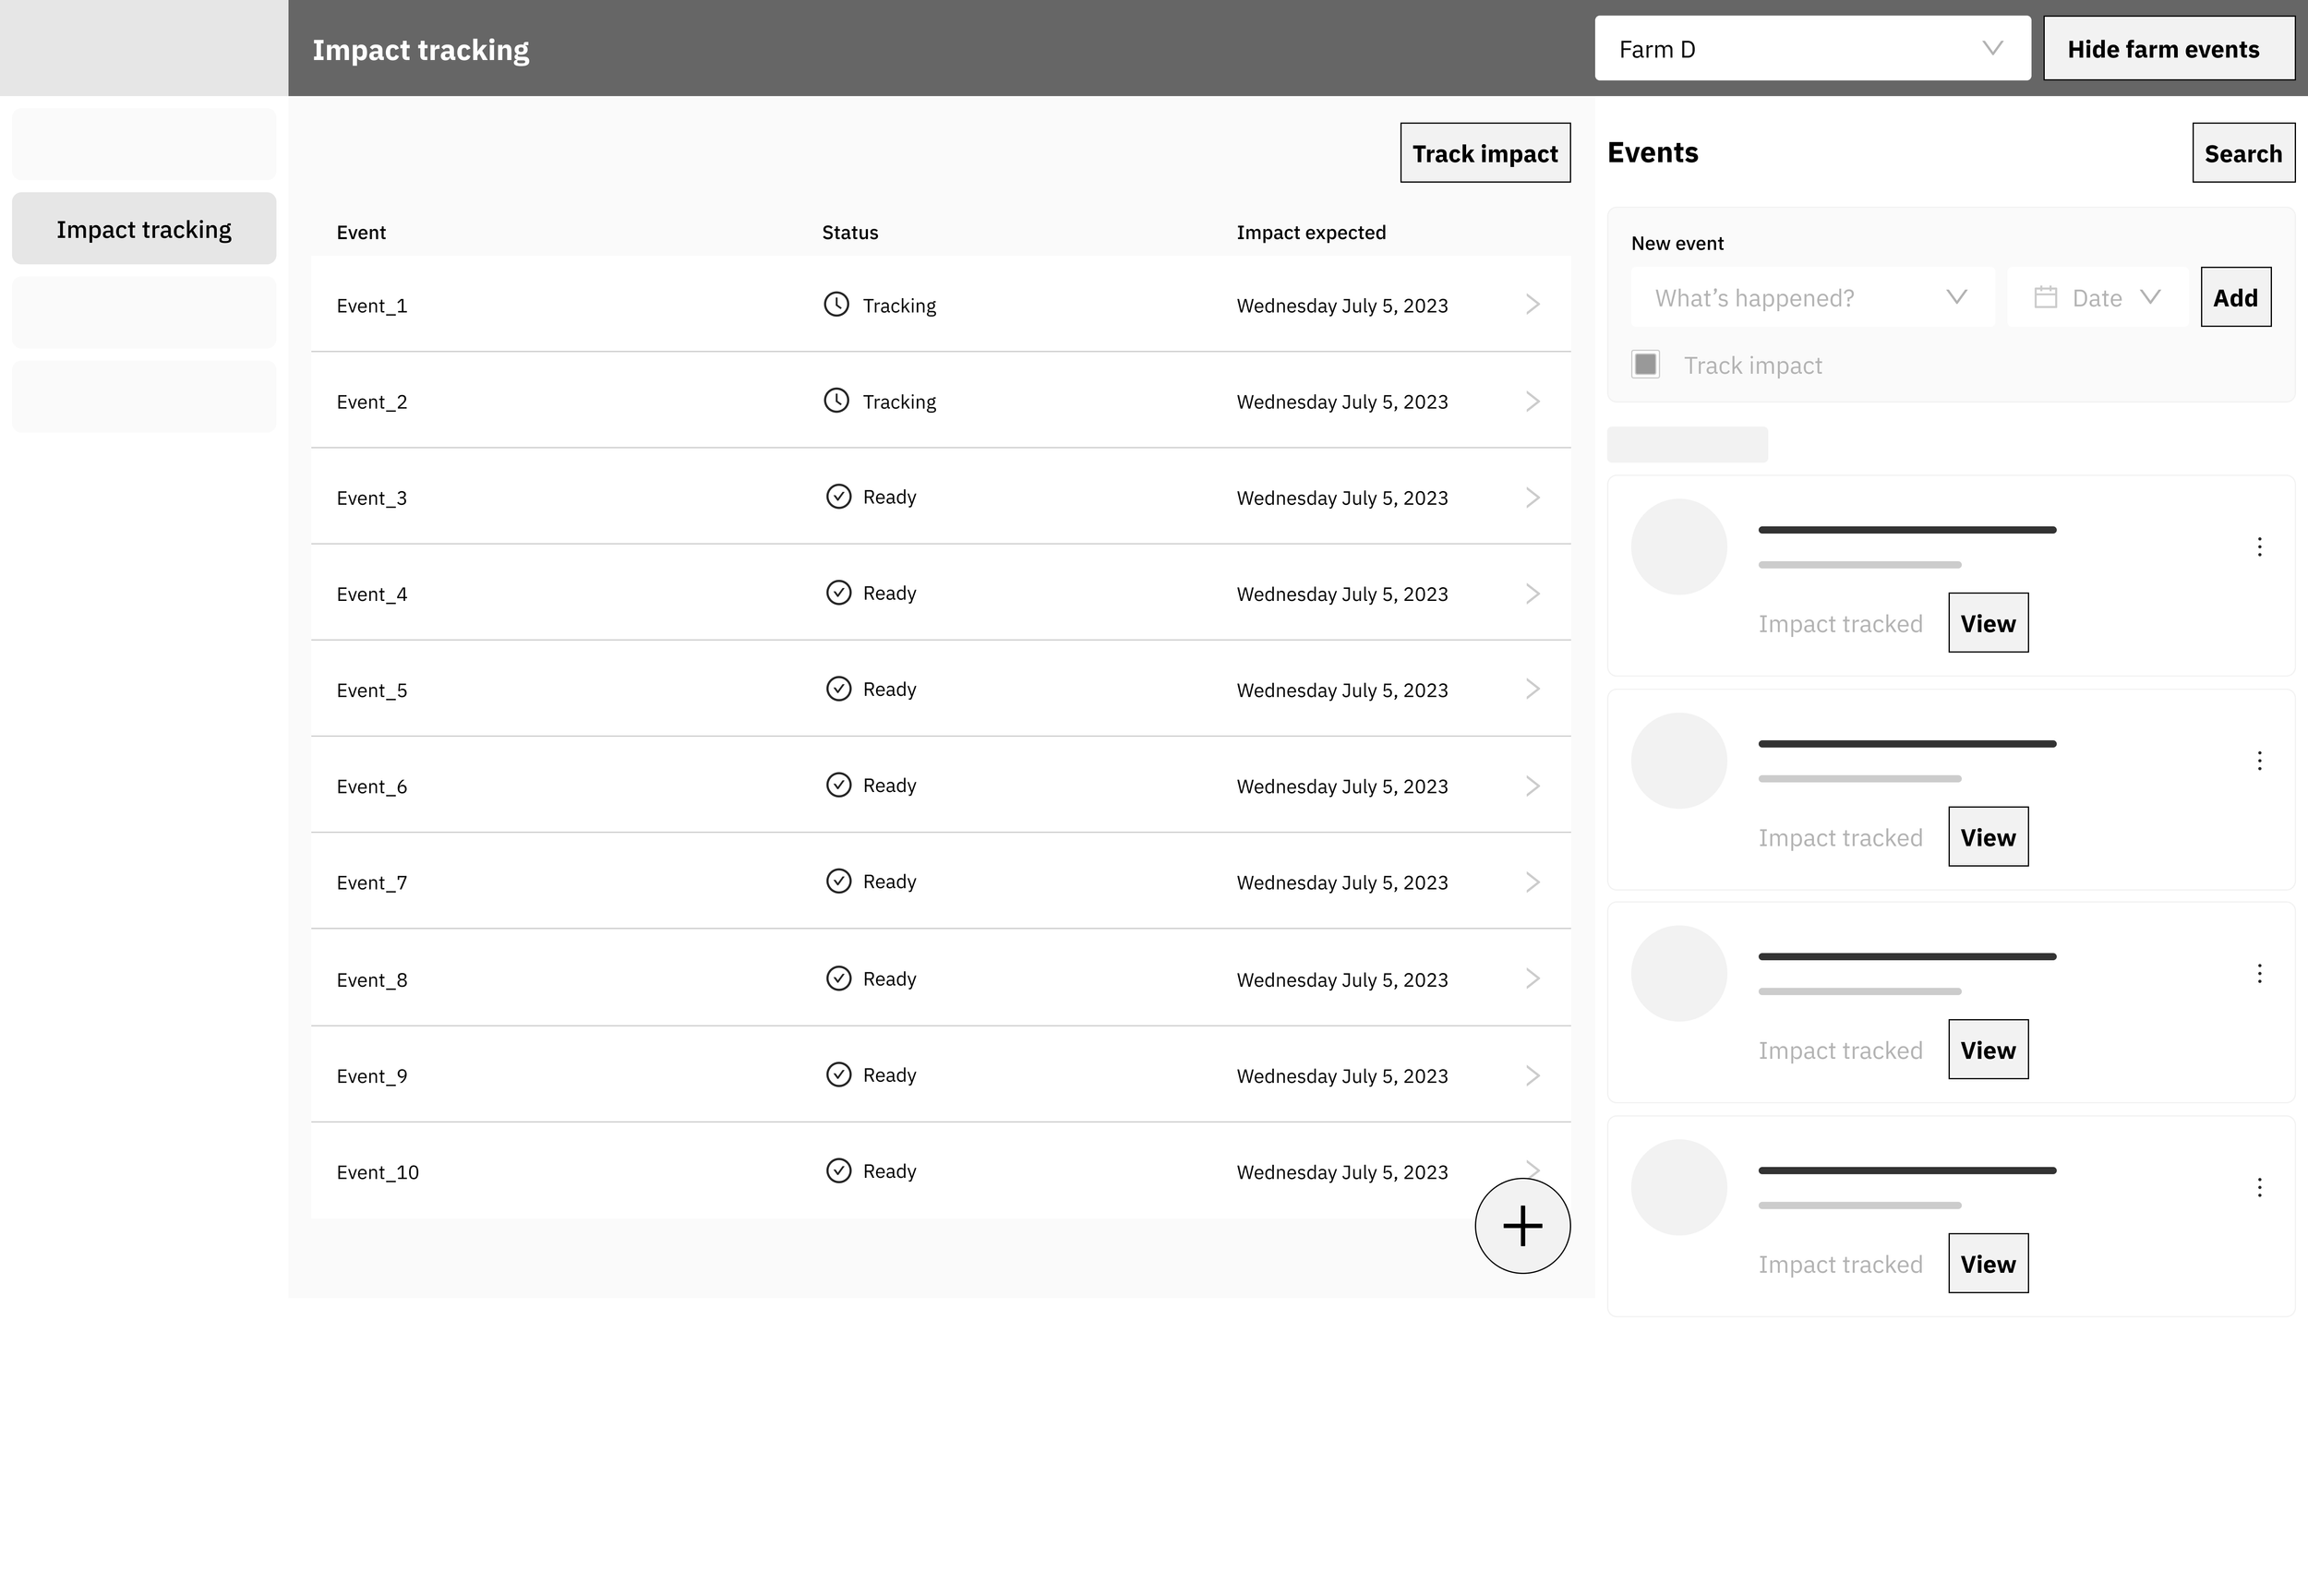
Main menu, timeline view, side view of event and its tracked metrics
Testing & Iterations:
I created higher fidelity prototypes. We tested them with real farm data, leading to two rounds of feedback-driven iterations.
This helped refine the design, ensuring it was both intuitive and effective.
We learned that
Users selected largely the same key metrics, so we could offer default tracked metrics for events rather than ask users to manually select them
The impact of weather events is too complex to track - we needed to find a better way of framing them
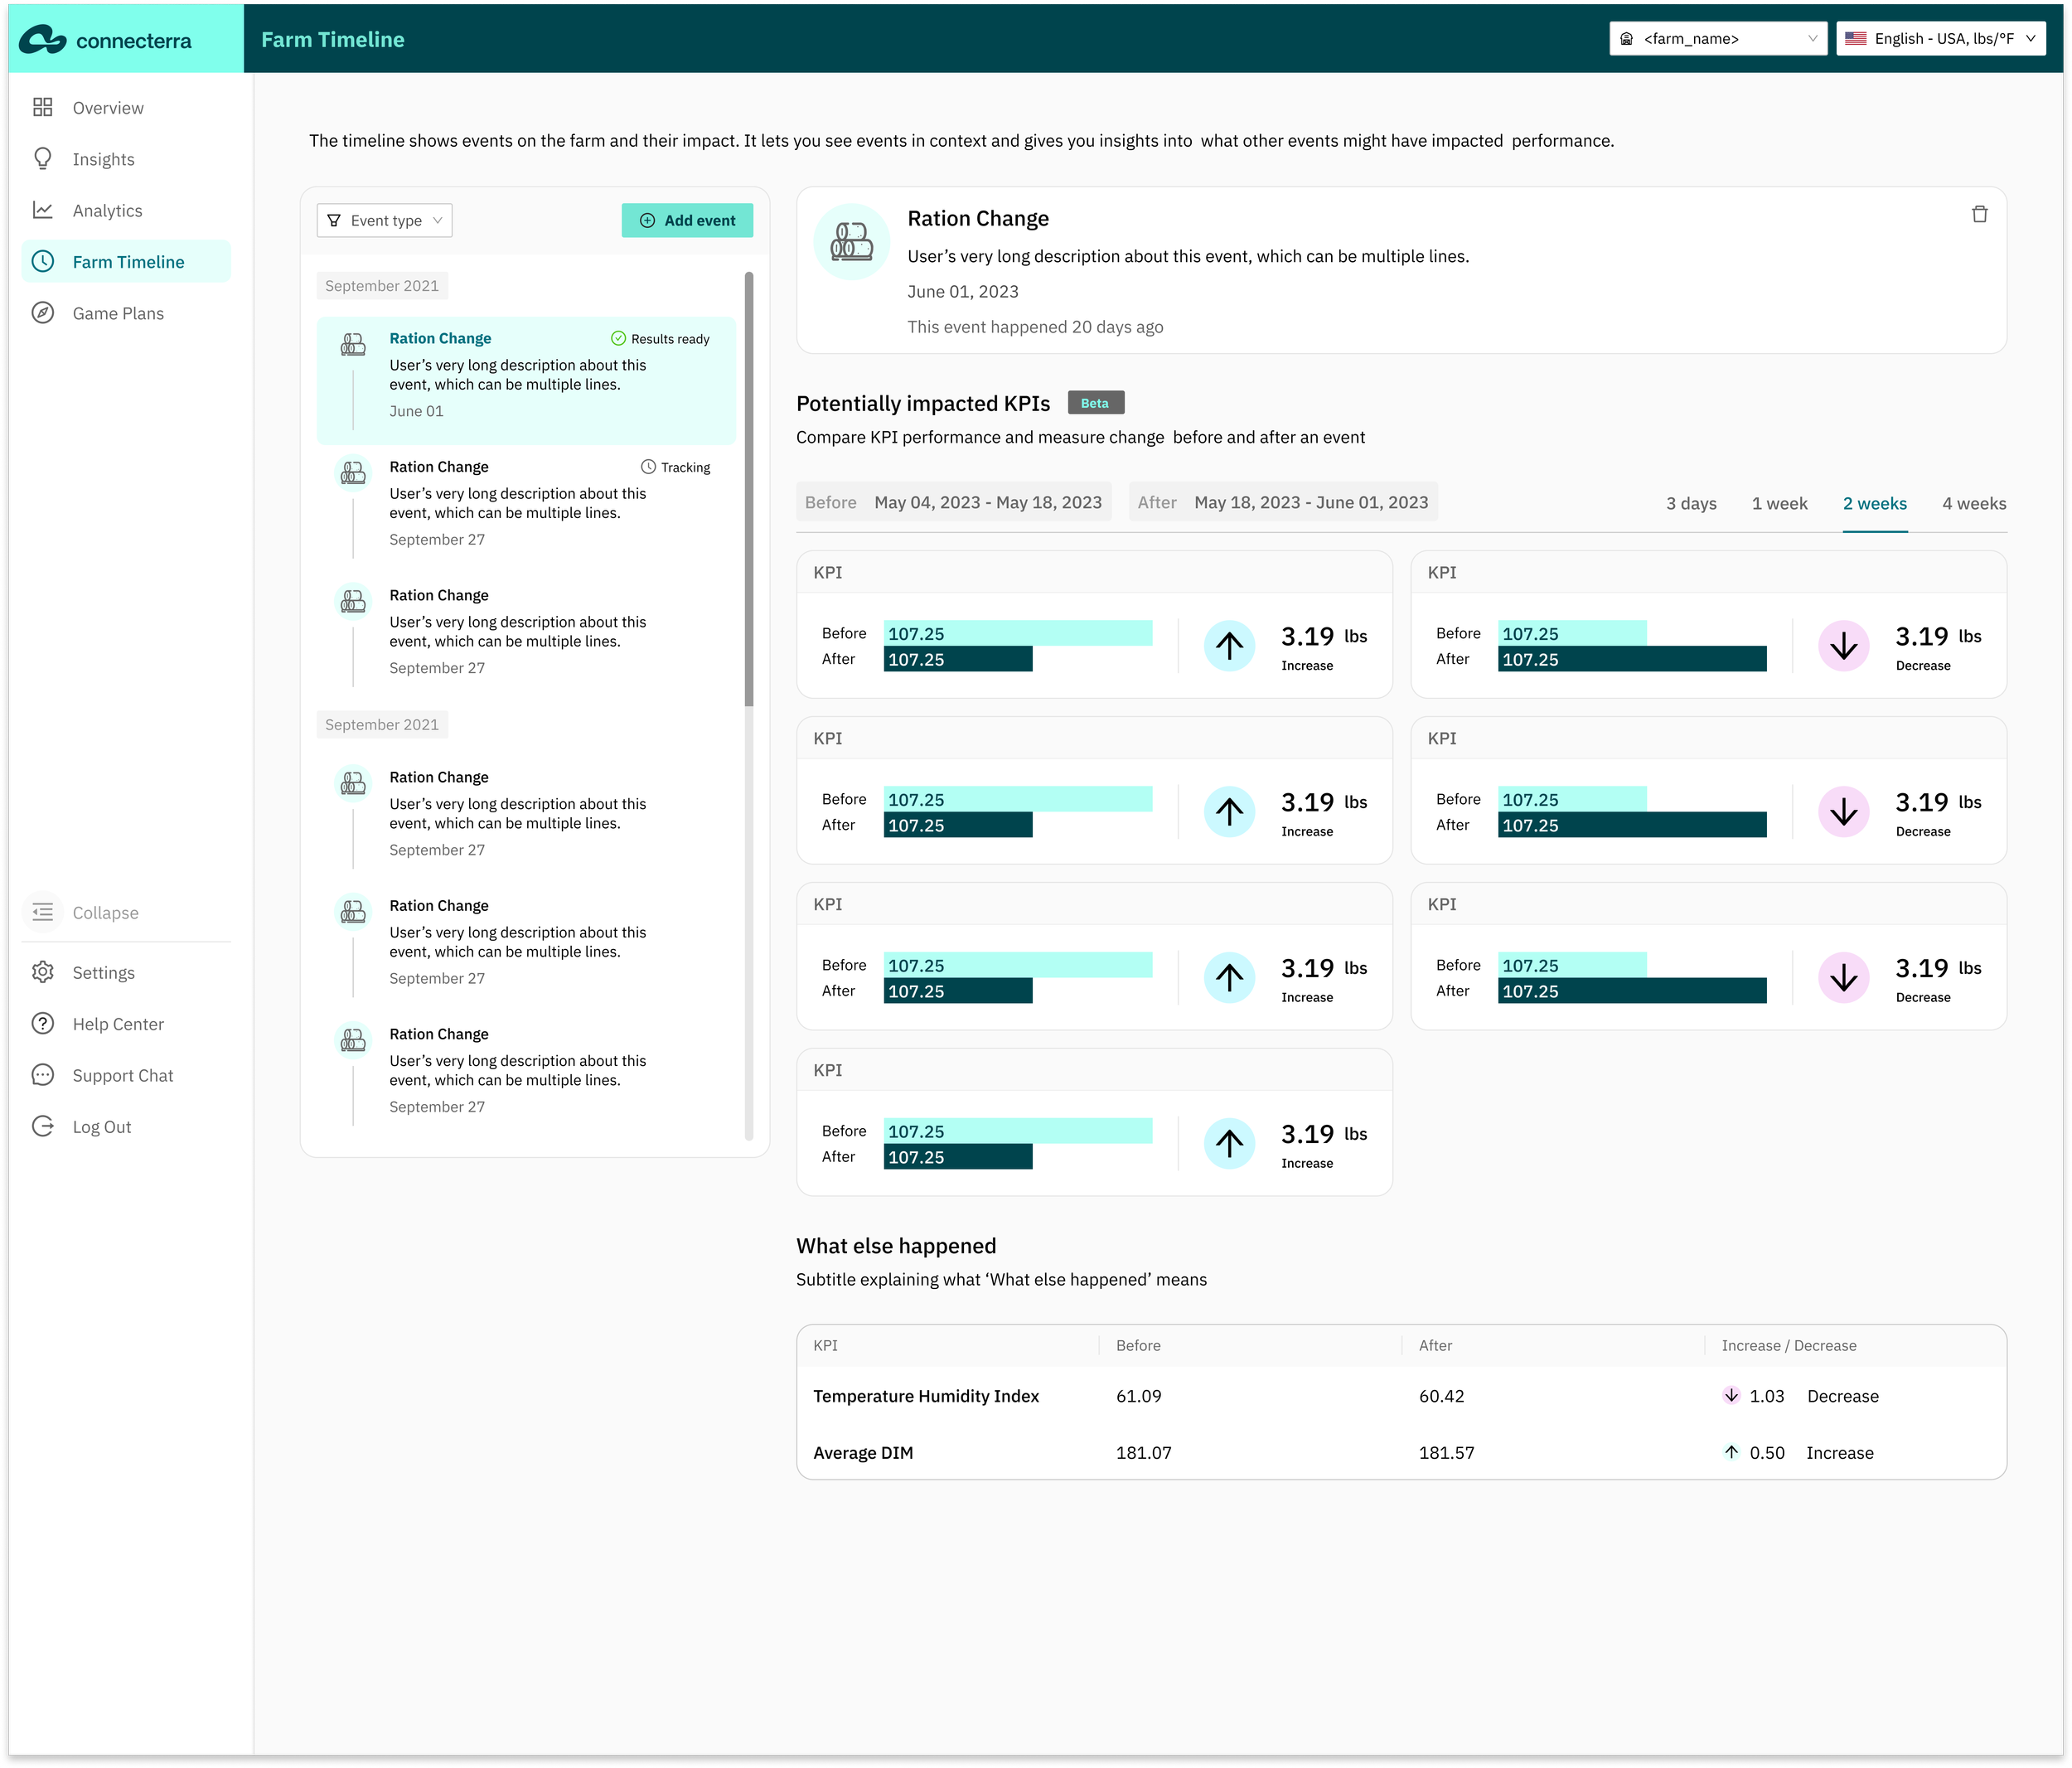
Users were really positive about the pre-defined time ranges ( 3 days / 1 week/ 2 weeks/ 1 month)
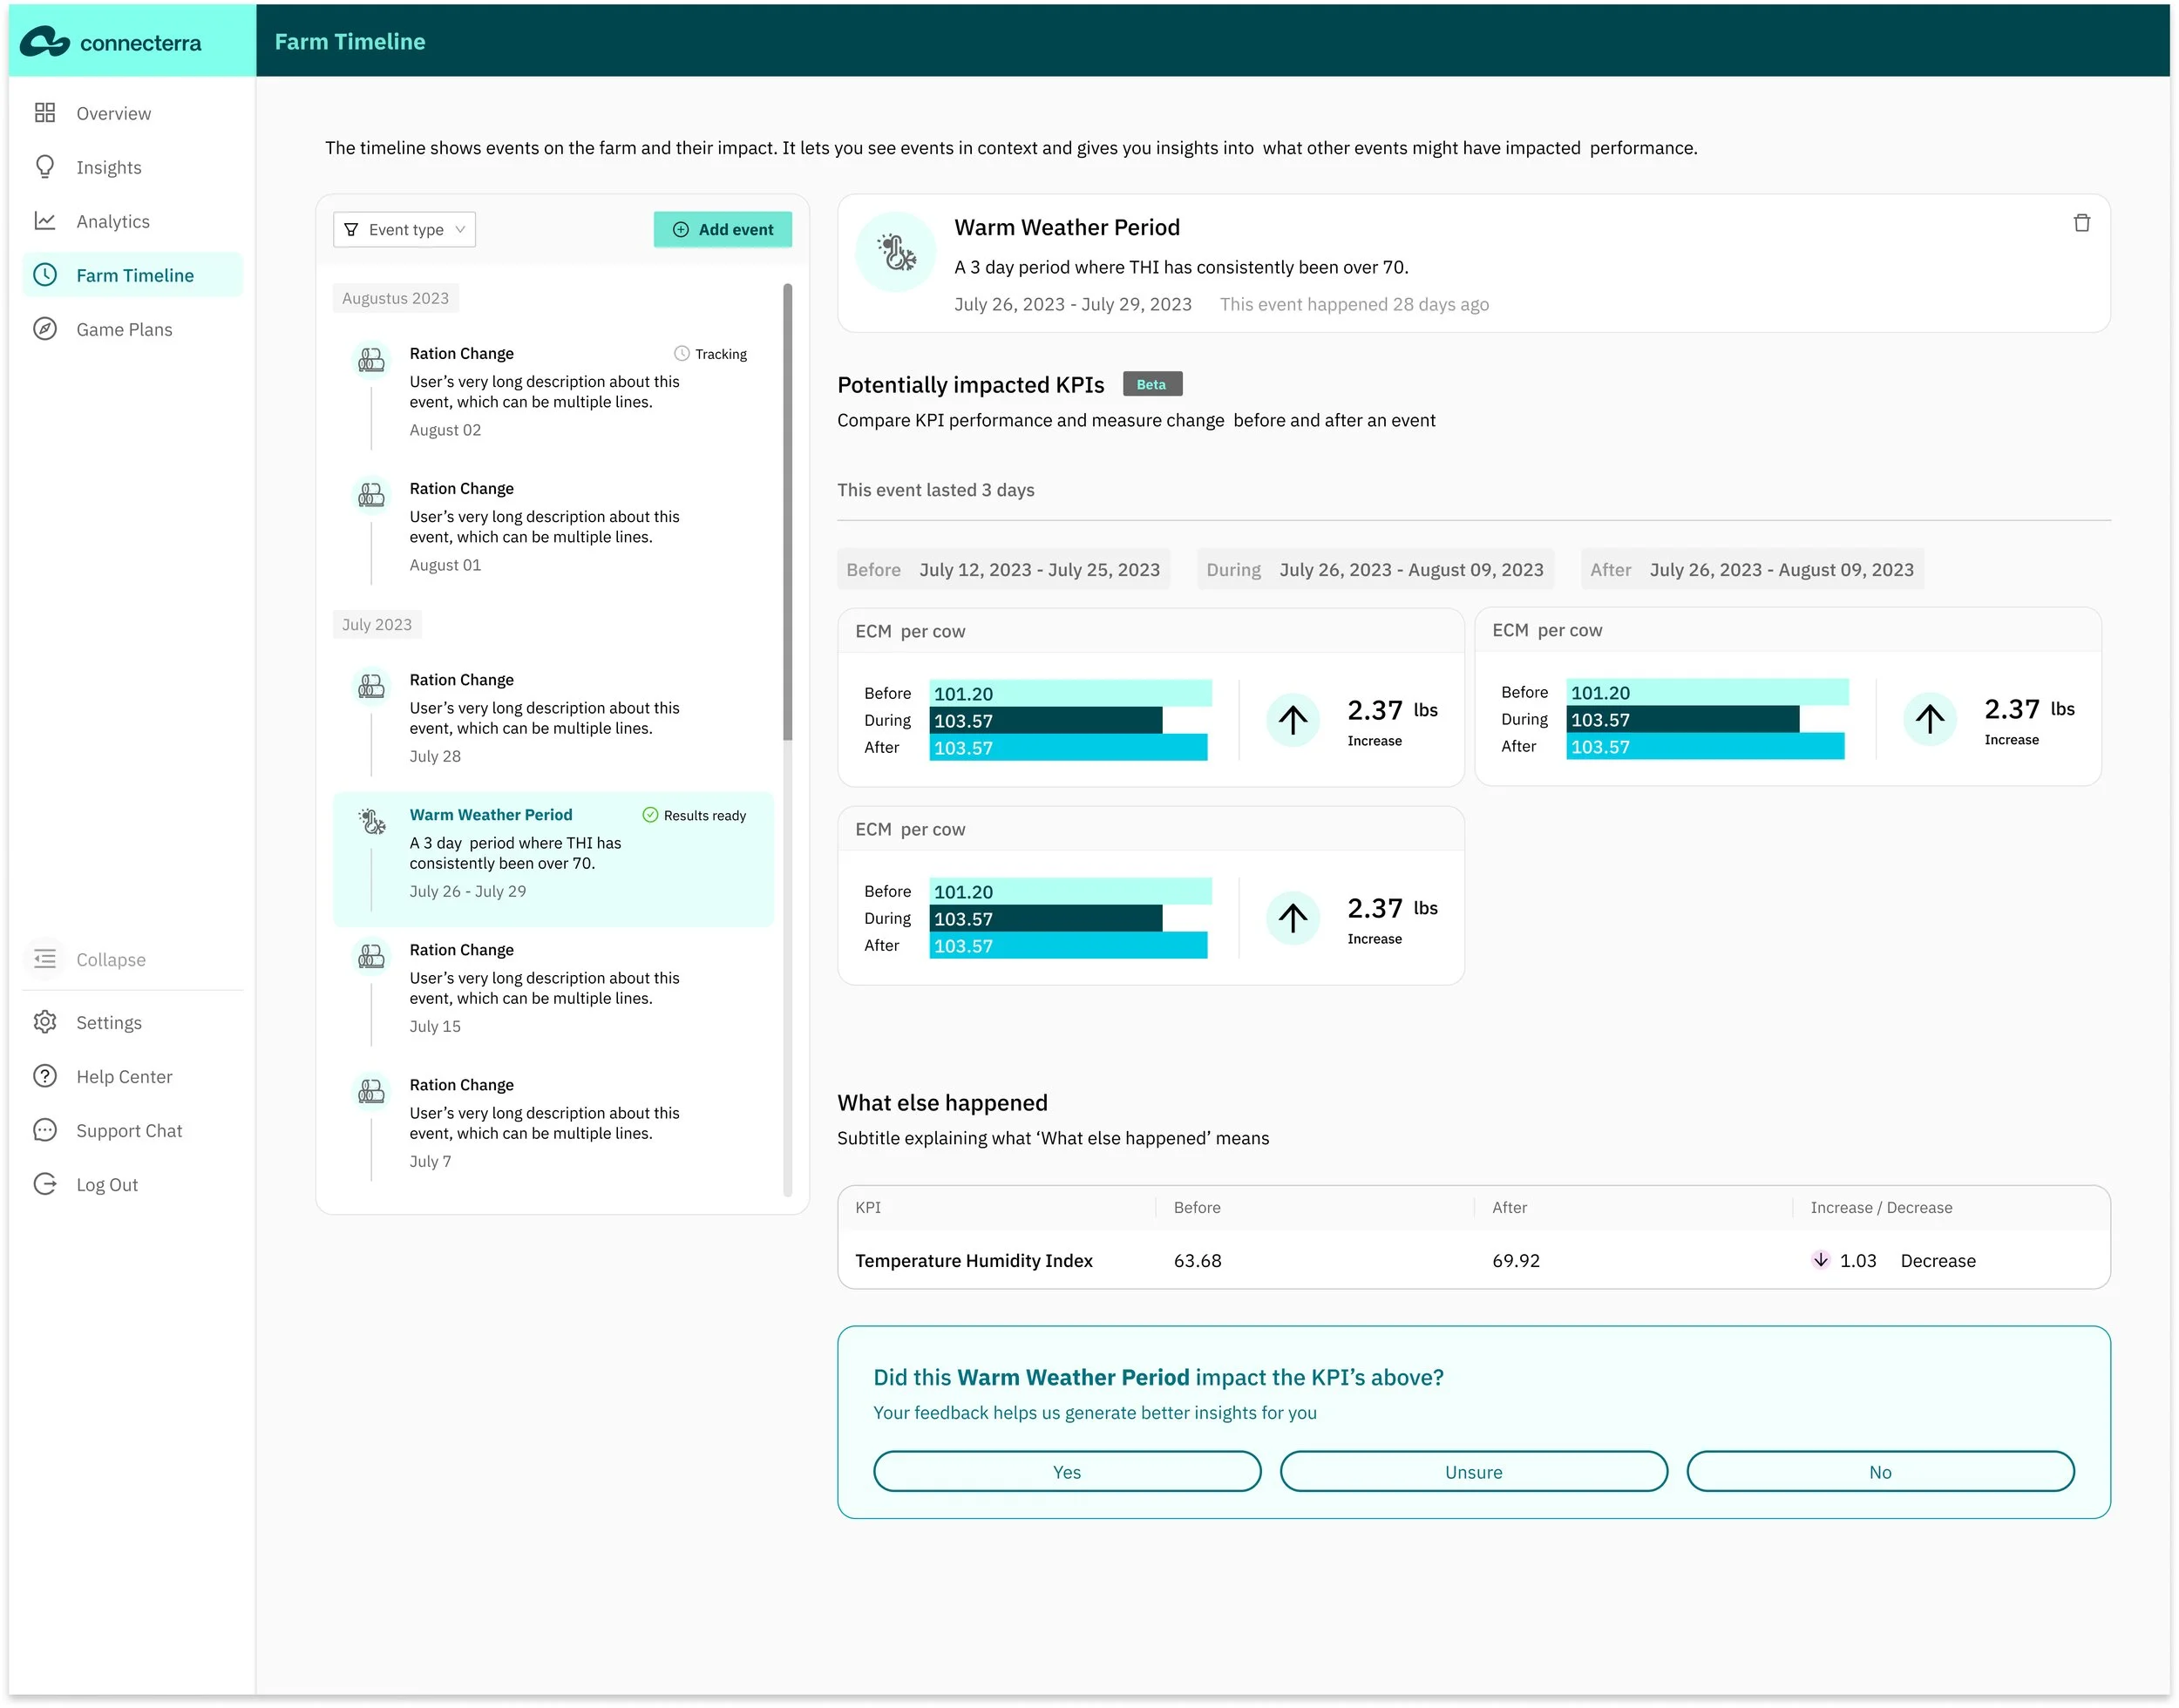
Final Design
The final tool included a streamlined timeline feature where farmers could track changes, particularly focusing on ration adjustments, and compare their impact on key farm metrics over time.
Key Features
Before and After Views: The tool provided clear before-and-after metrics for specific changes, enabling better decision-making.
Default Metrics: We predefined important metrics such as animal health and production levels based on user feedback, which helped users avoid the need for extensive customization.
Simplified Interaction Pattern: The timeline was designed to be user-friendly, with minimal steps to record and review changes.

Achievements & Metrics
Increased Feature Adoption:
Within the first 6 months of launch, the Farm Timeline tool saw a 80% adoption rate among active users, becoming one of the primary drivers of engagement on the platform.Conversion Growth:
The addition of the tracking tool contributed to a 30% increase in user conversions (from free trial to paid users), helping cement product-market fit.Improved User Retention:
User retention rates for those who adopted the Farm Timeline increased by 20%, as the tool provided significant value, keeping users engaged with the platform.Time Saved for Farmers:
Based on user feedback, farmers reported saving an average of 2-3 hours per week on manually tracking farm events, thanks to the streamlined digital solution.
“I really use that quite a bit. It’s a real easy way to map changes. Previously, I had to dig into other systems or just write things down on the calendar. It’s been great”
“ I can’t overstate the value of the Farm Timeline, it has been huge.”