Income and Disability Calculator
problem
Pension providers need to show customers how their income could be affected if they were incapacitated to work.
approach
There were no competitors at the time to benchmark against, so I approached this by researching pension regulations, aiming to simplify the scenarios, and user testing the prototype.
output
Requirement gathering, info-graphics, wireframes, interactive prototype, user testing, visual design.
My role
Working with a multidisciplinary development team, I was the designer responsible for the User Experience.
Context
A regulation was introduced in the Netherlands that requires employers to show their employees what coverage and how much income they can expect in case of disability.
The amount is affected by different factors such as the particular insurance product, the age of the person and how much they are still able to work.
This makes disability scenarios very complex. What’s more, regulations limit how much information can be simplified.
solution
To solve this problem, I quickly realized that if we were to simplify all the complexity as much as possible while still being accurate, it was important that we as a team understood what we were trying to show.
I researched Dutch disability laws, interviewed internal stakeholders with knowledge of the subject. I turned the results into a diagram that I shared with the team and we used to check whether our understanding was correct.
One of the diagrams based on stakeholder interviews and research, used as an alignment tool
When the factors affecting the income became clear, I worked on the first design iterations.
With the UX Researchers, we tested the prototypes at the User Experience Center at Aegon. Based on the findings, we iterated on the design.
We simplified the design when displaying on mobile devices.
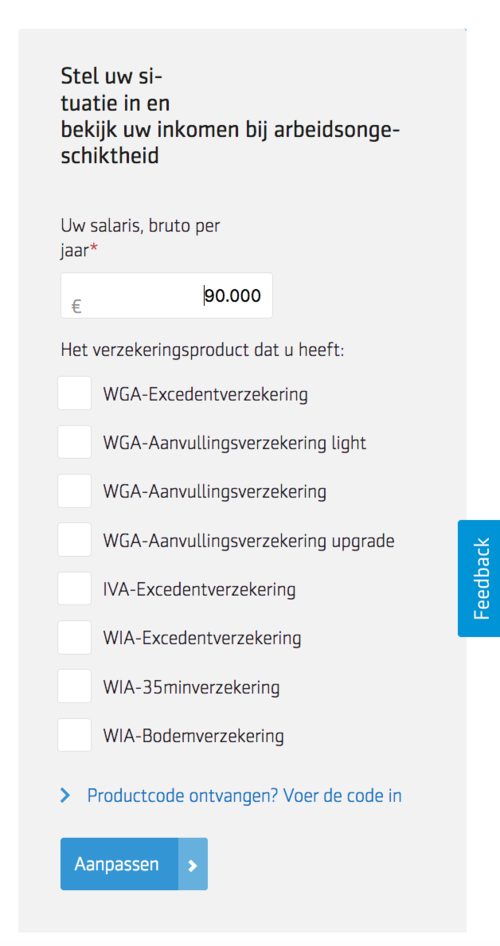
Select your coverage

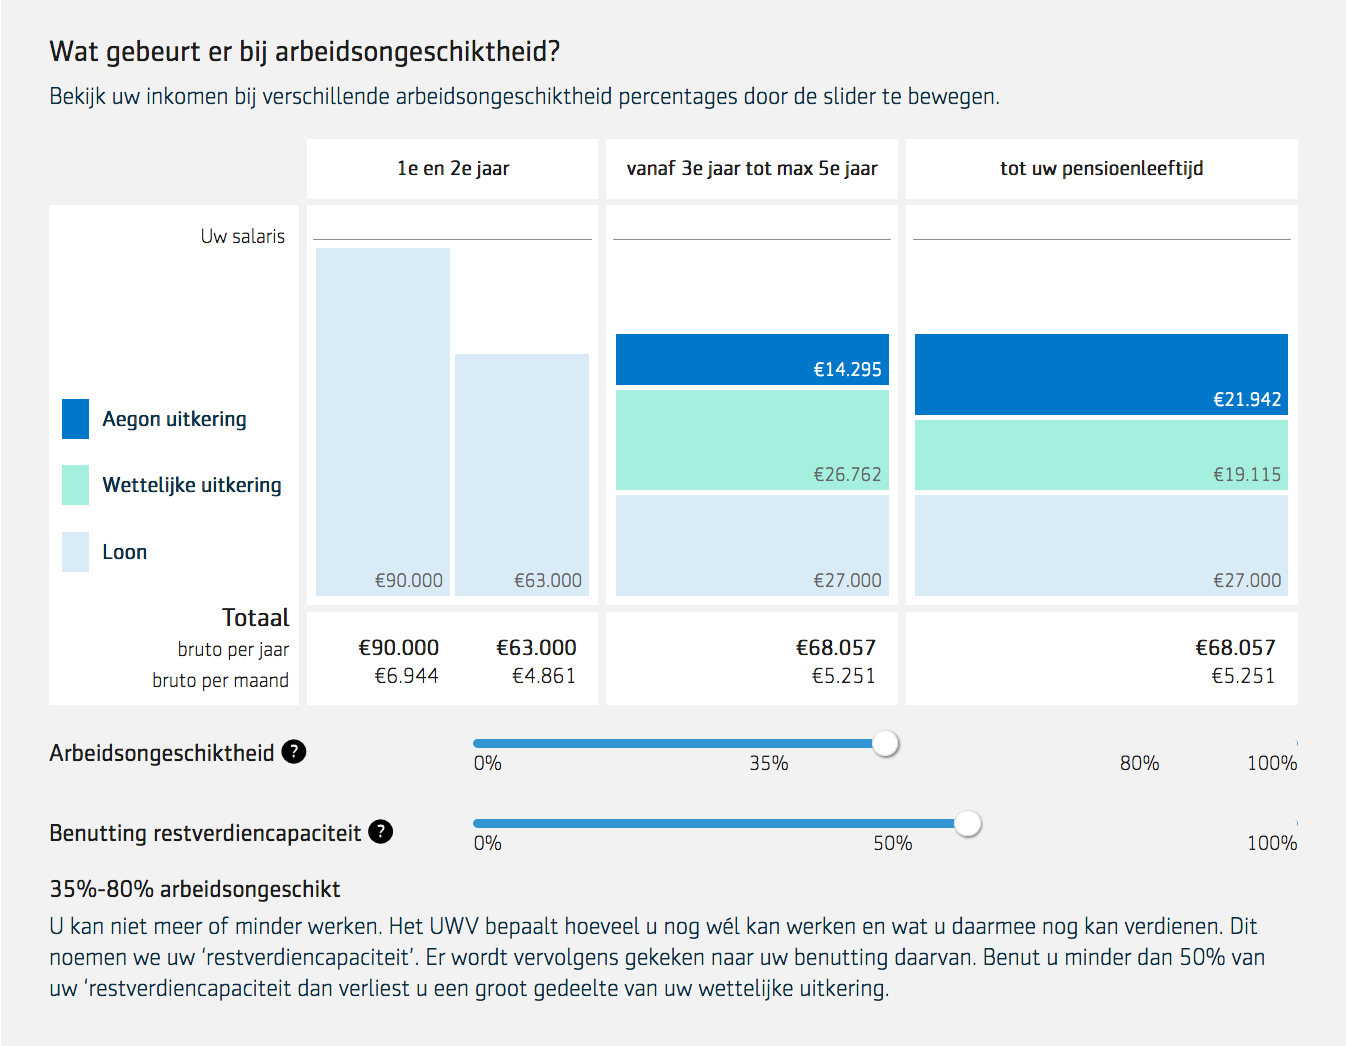
See how disability can affect your income
Desktop view
You can see the live version following this link.
To see more of my work,
New outcome flow